OPC UA Explorer
Find the OPC UA servers on the networks your PC is on, open one, and see its address space with every variable's value, data type, access level and status. Read-only.
What it is
An OPC UA server describes itself: it lists its endpoints, and its address space can be browsed from the Objects folder down. The explorer does exactly that, as any OPC UA client would, and shows the result in a table you can filter and export. It uses FindServers, GetEndpoints, Browse and Read, nothing else: no writes, no subscriptions, no method calls.
It runs as one executable (Modbus-Logic-OPC-UA-Explorer.exe on Windows, a .deb on Debian, Ubuntu and Raspberry Pi OS x64) that opens its page in your browser at http://127.0.0.1:<port>. The local server answers this machine only.
A worked example: a pump house server
The screens below come from the explorer's own mock server, a small OPC UA server on this PC at opc.tcp://127.0.0.1:4840/PumpHouse that offers a *PumpHouse* folder with a pump (speed, temperature, running, name) and a main meter (line voltage, energy counter, a phases array, and a *Fault* variable that refuses to be read). A PLC, a SCADA gateway or a historian on the network works the same way; only the address and the sign-in change.
- Replace the Network ranges with
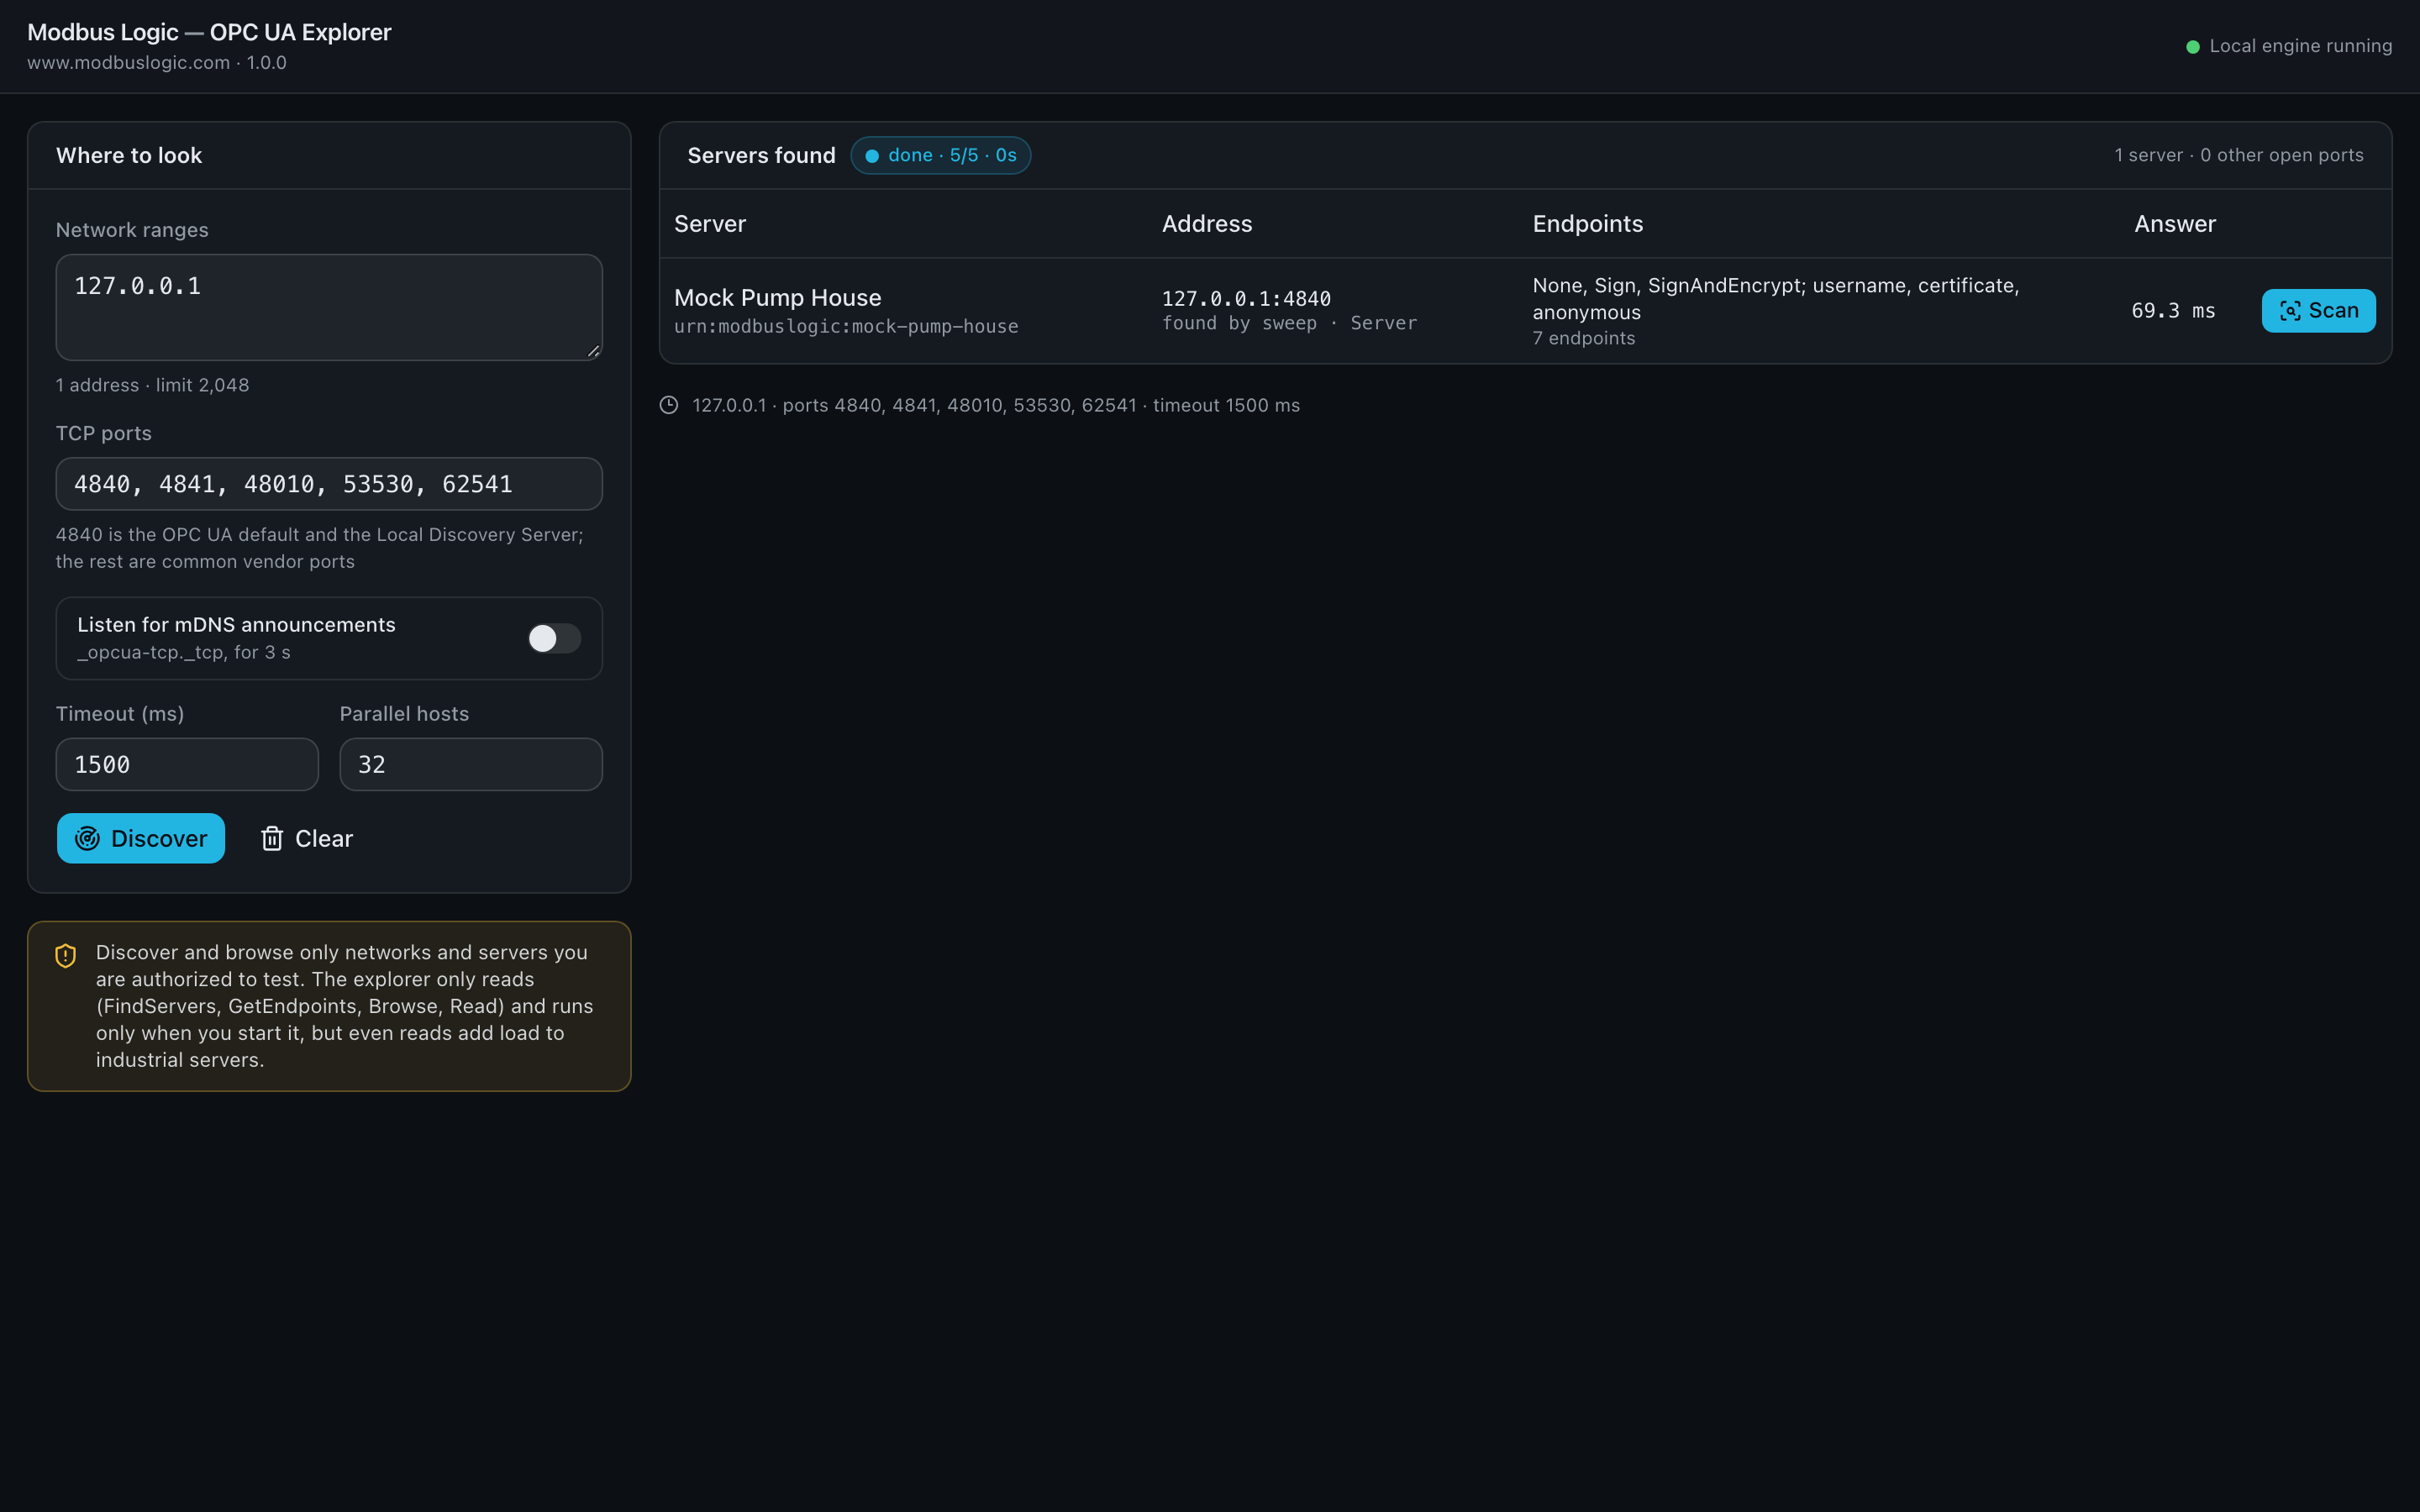
127.0.0.1, since this server is on the same PC, and turn mDNS off: a loopback server does not announce itself. Leave the ports as they are; 4840 is among them. - Press Discover. The sweep asks each open port to name its servers, and one row appears: *Mock Pump House*, its application URI, the address it answered at, and its endpoints in one line. The mock server offers seven of them, from *None* to *SignAndEncrypt*, each accepting anonymous, user name and certificate sign-in.
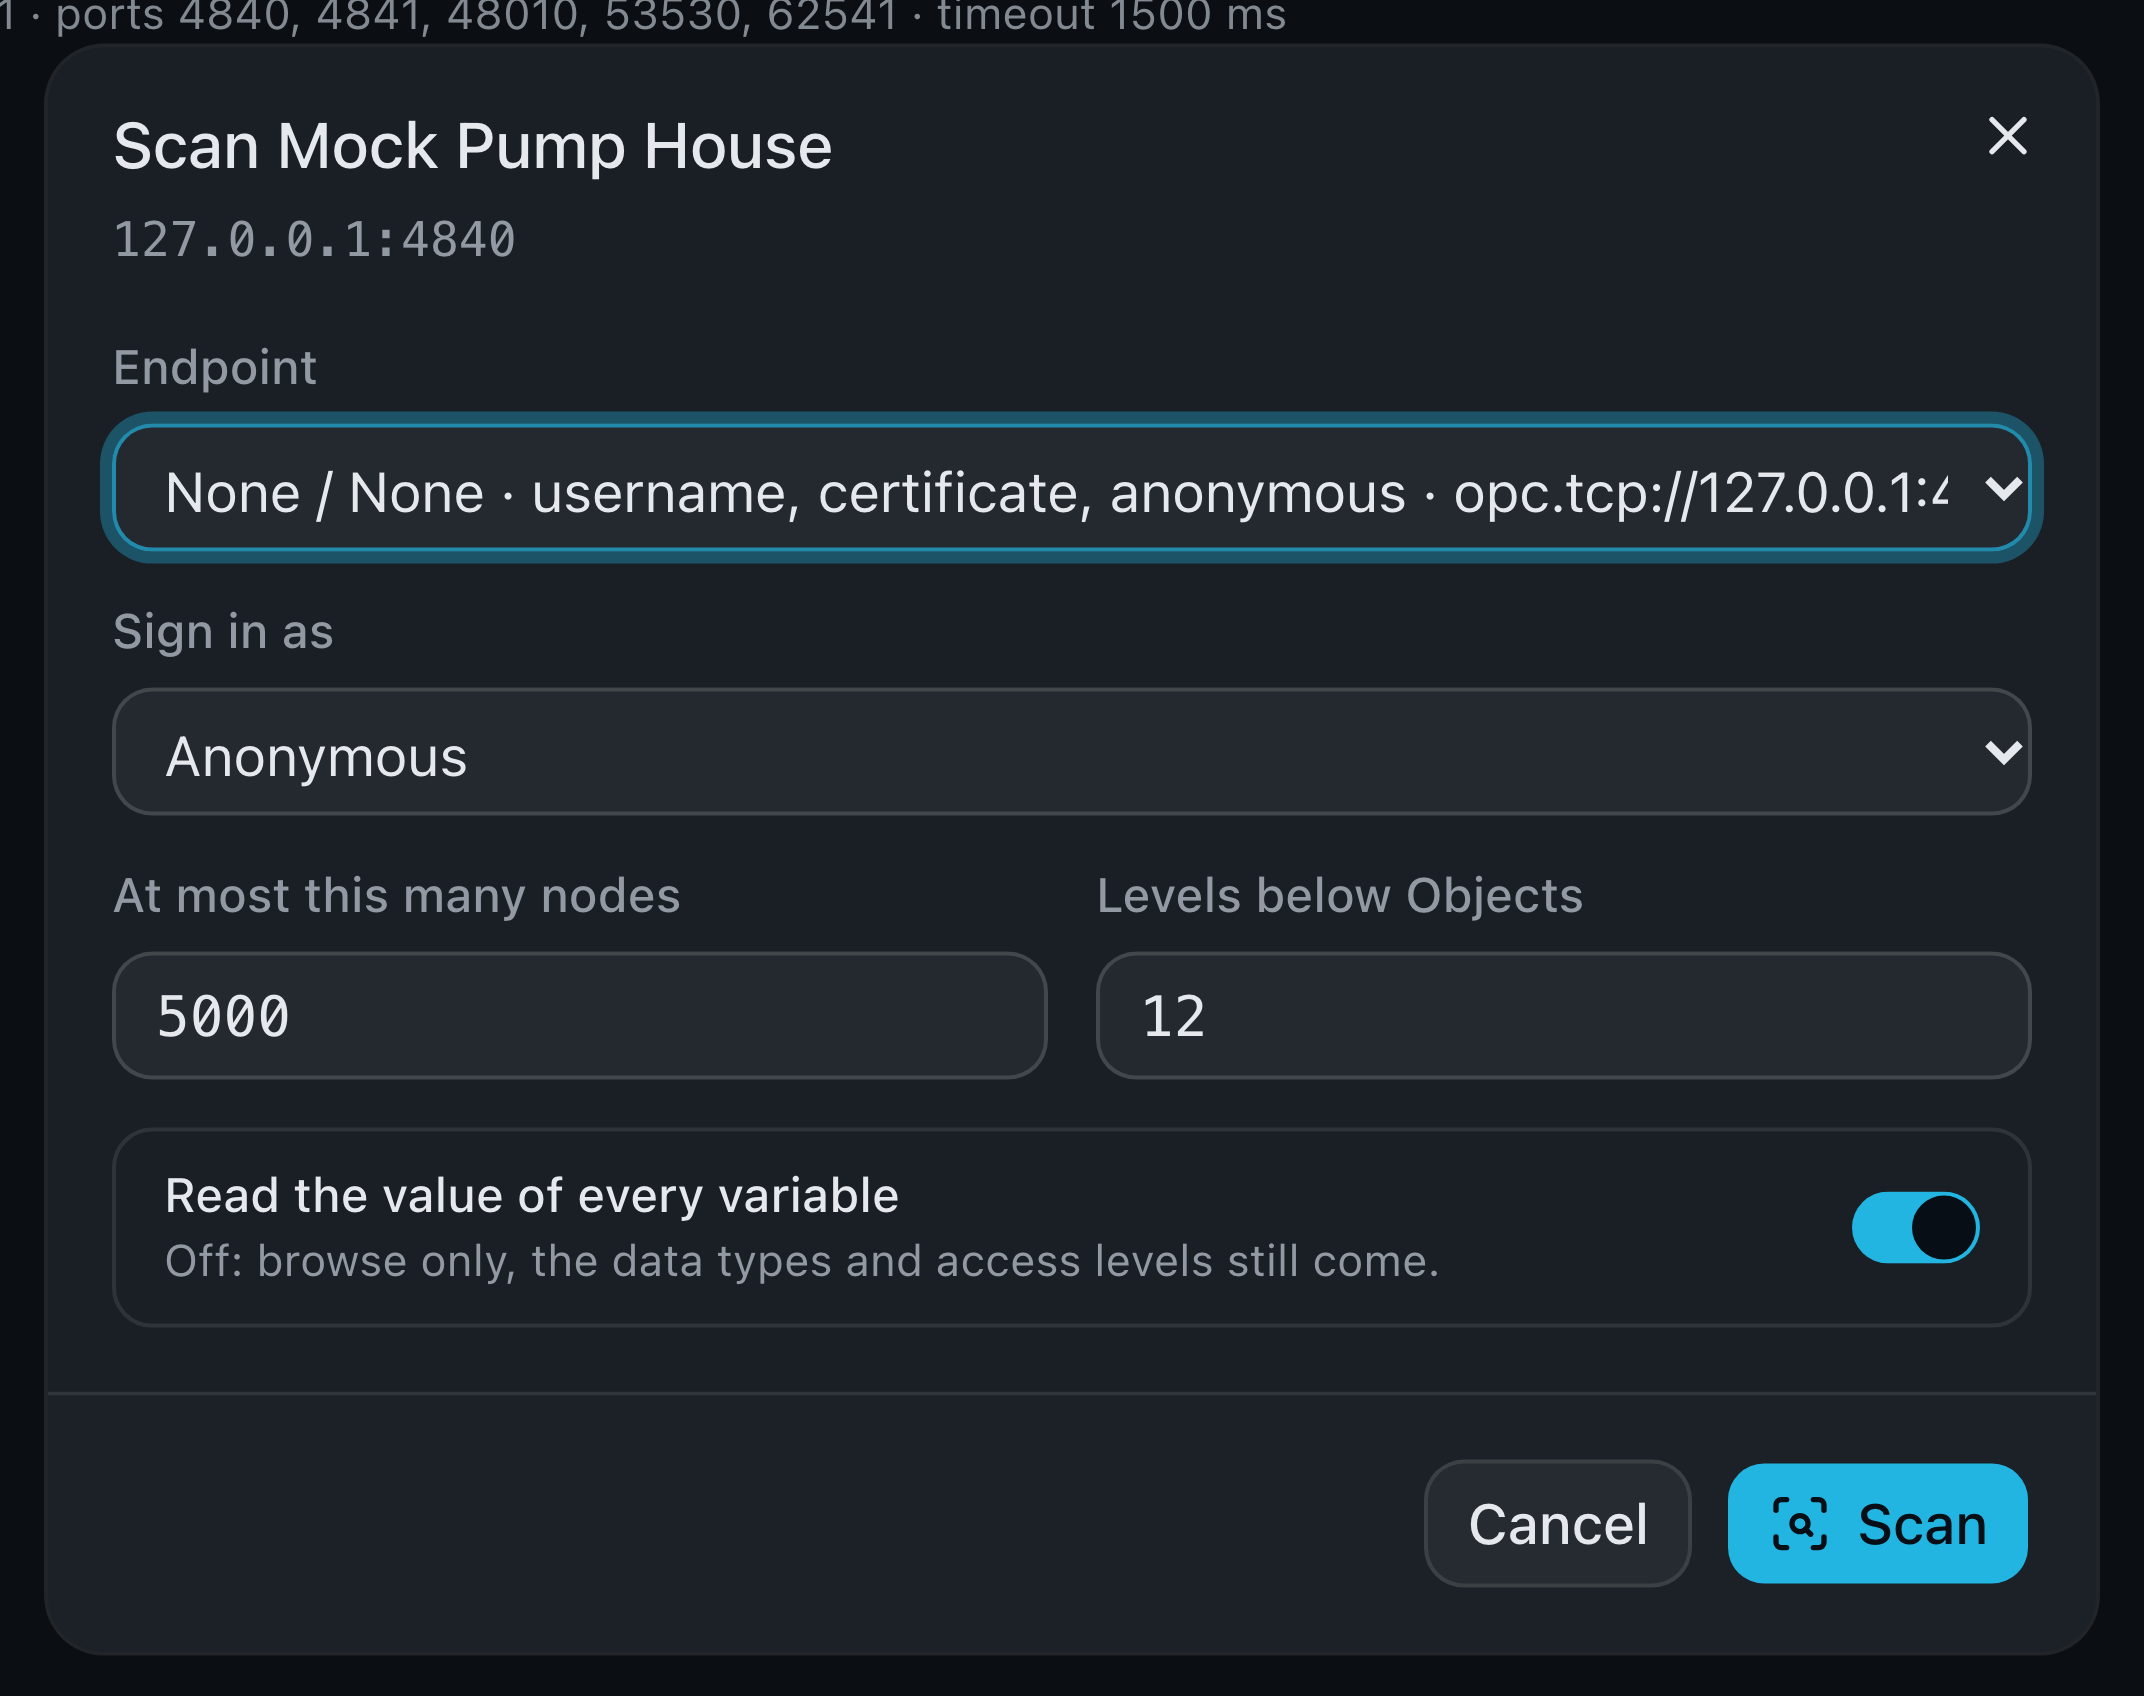
- Press Scan on the row. The dialog lists the endpoints least demanding first; keep *None / None* and *Anonymous*, the limits of 5000 nodes and 12 levels, and leave Read the value of every variable on.
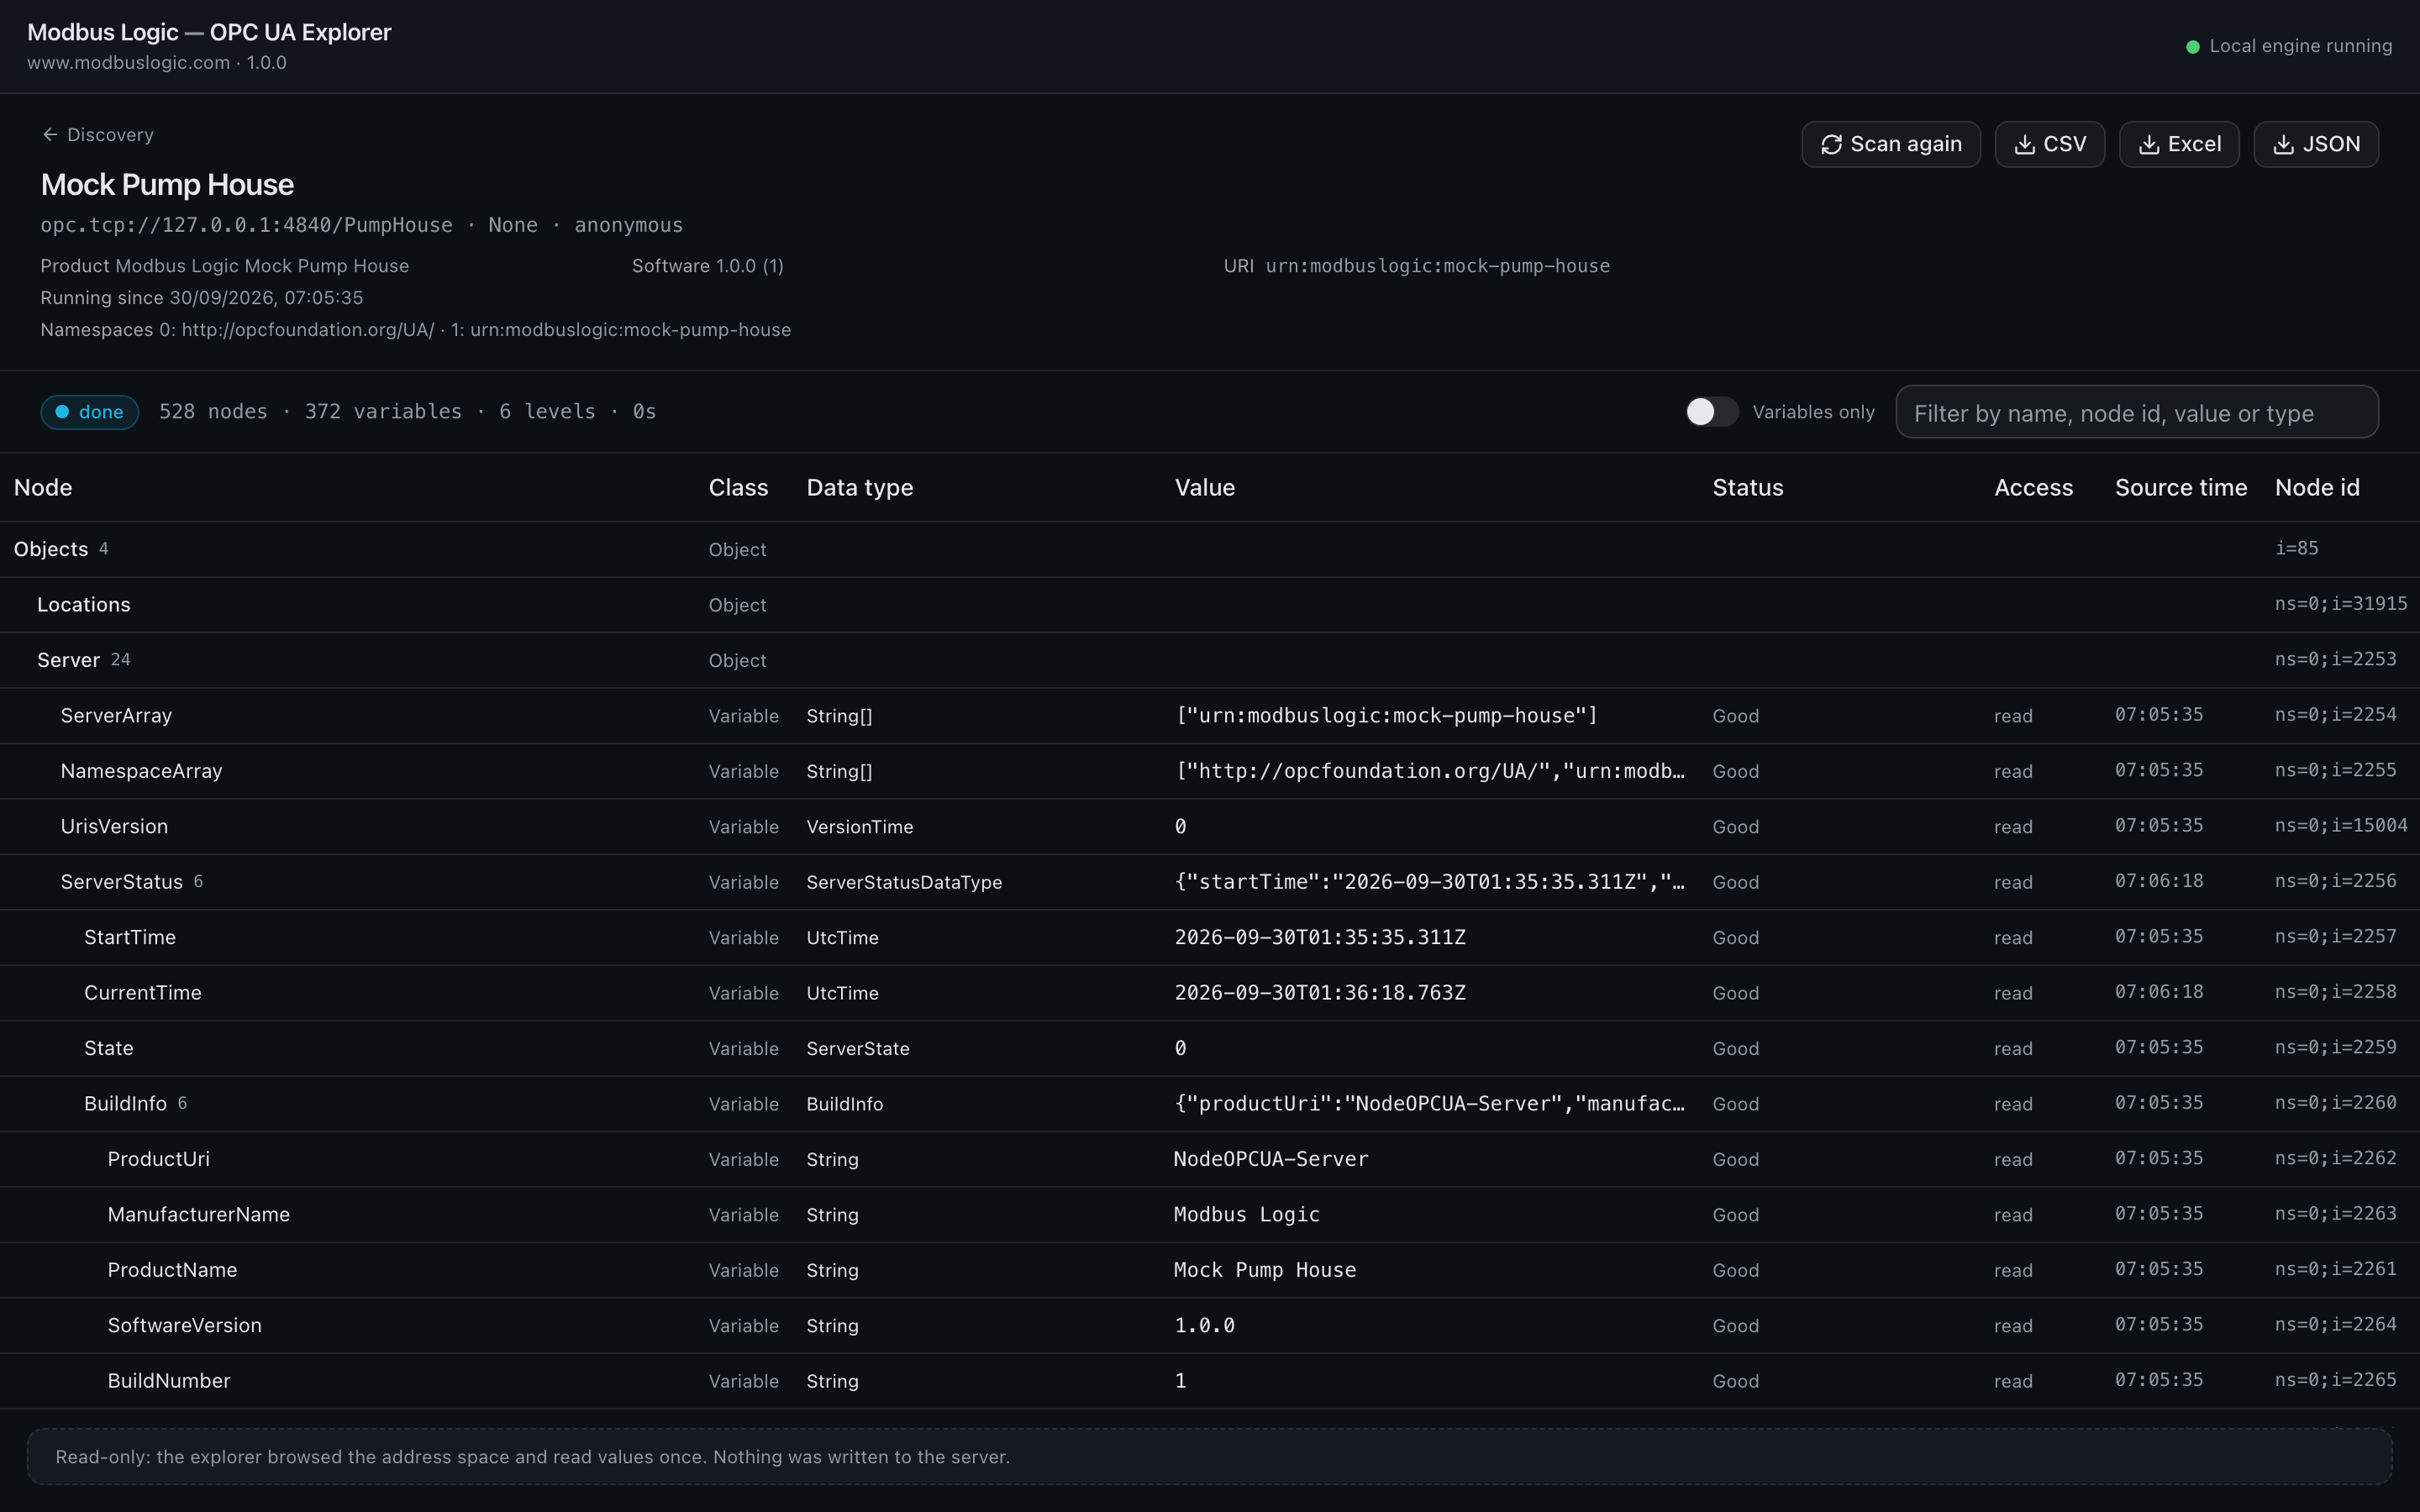
The result page fills in under a second: 528 nodes, 372 variables, 6 levels. The header shows what the server said about itself: the product name, software version, when it started and its two namespaces. The table starts at the Objects folder with the standard *Server* object, whose hundreds of variables describe the server's capabilities and diagnostics, followed by the *PumpHouse* folder.
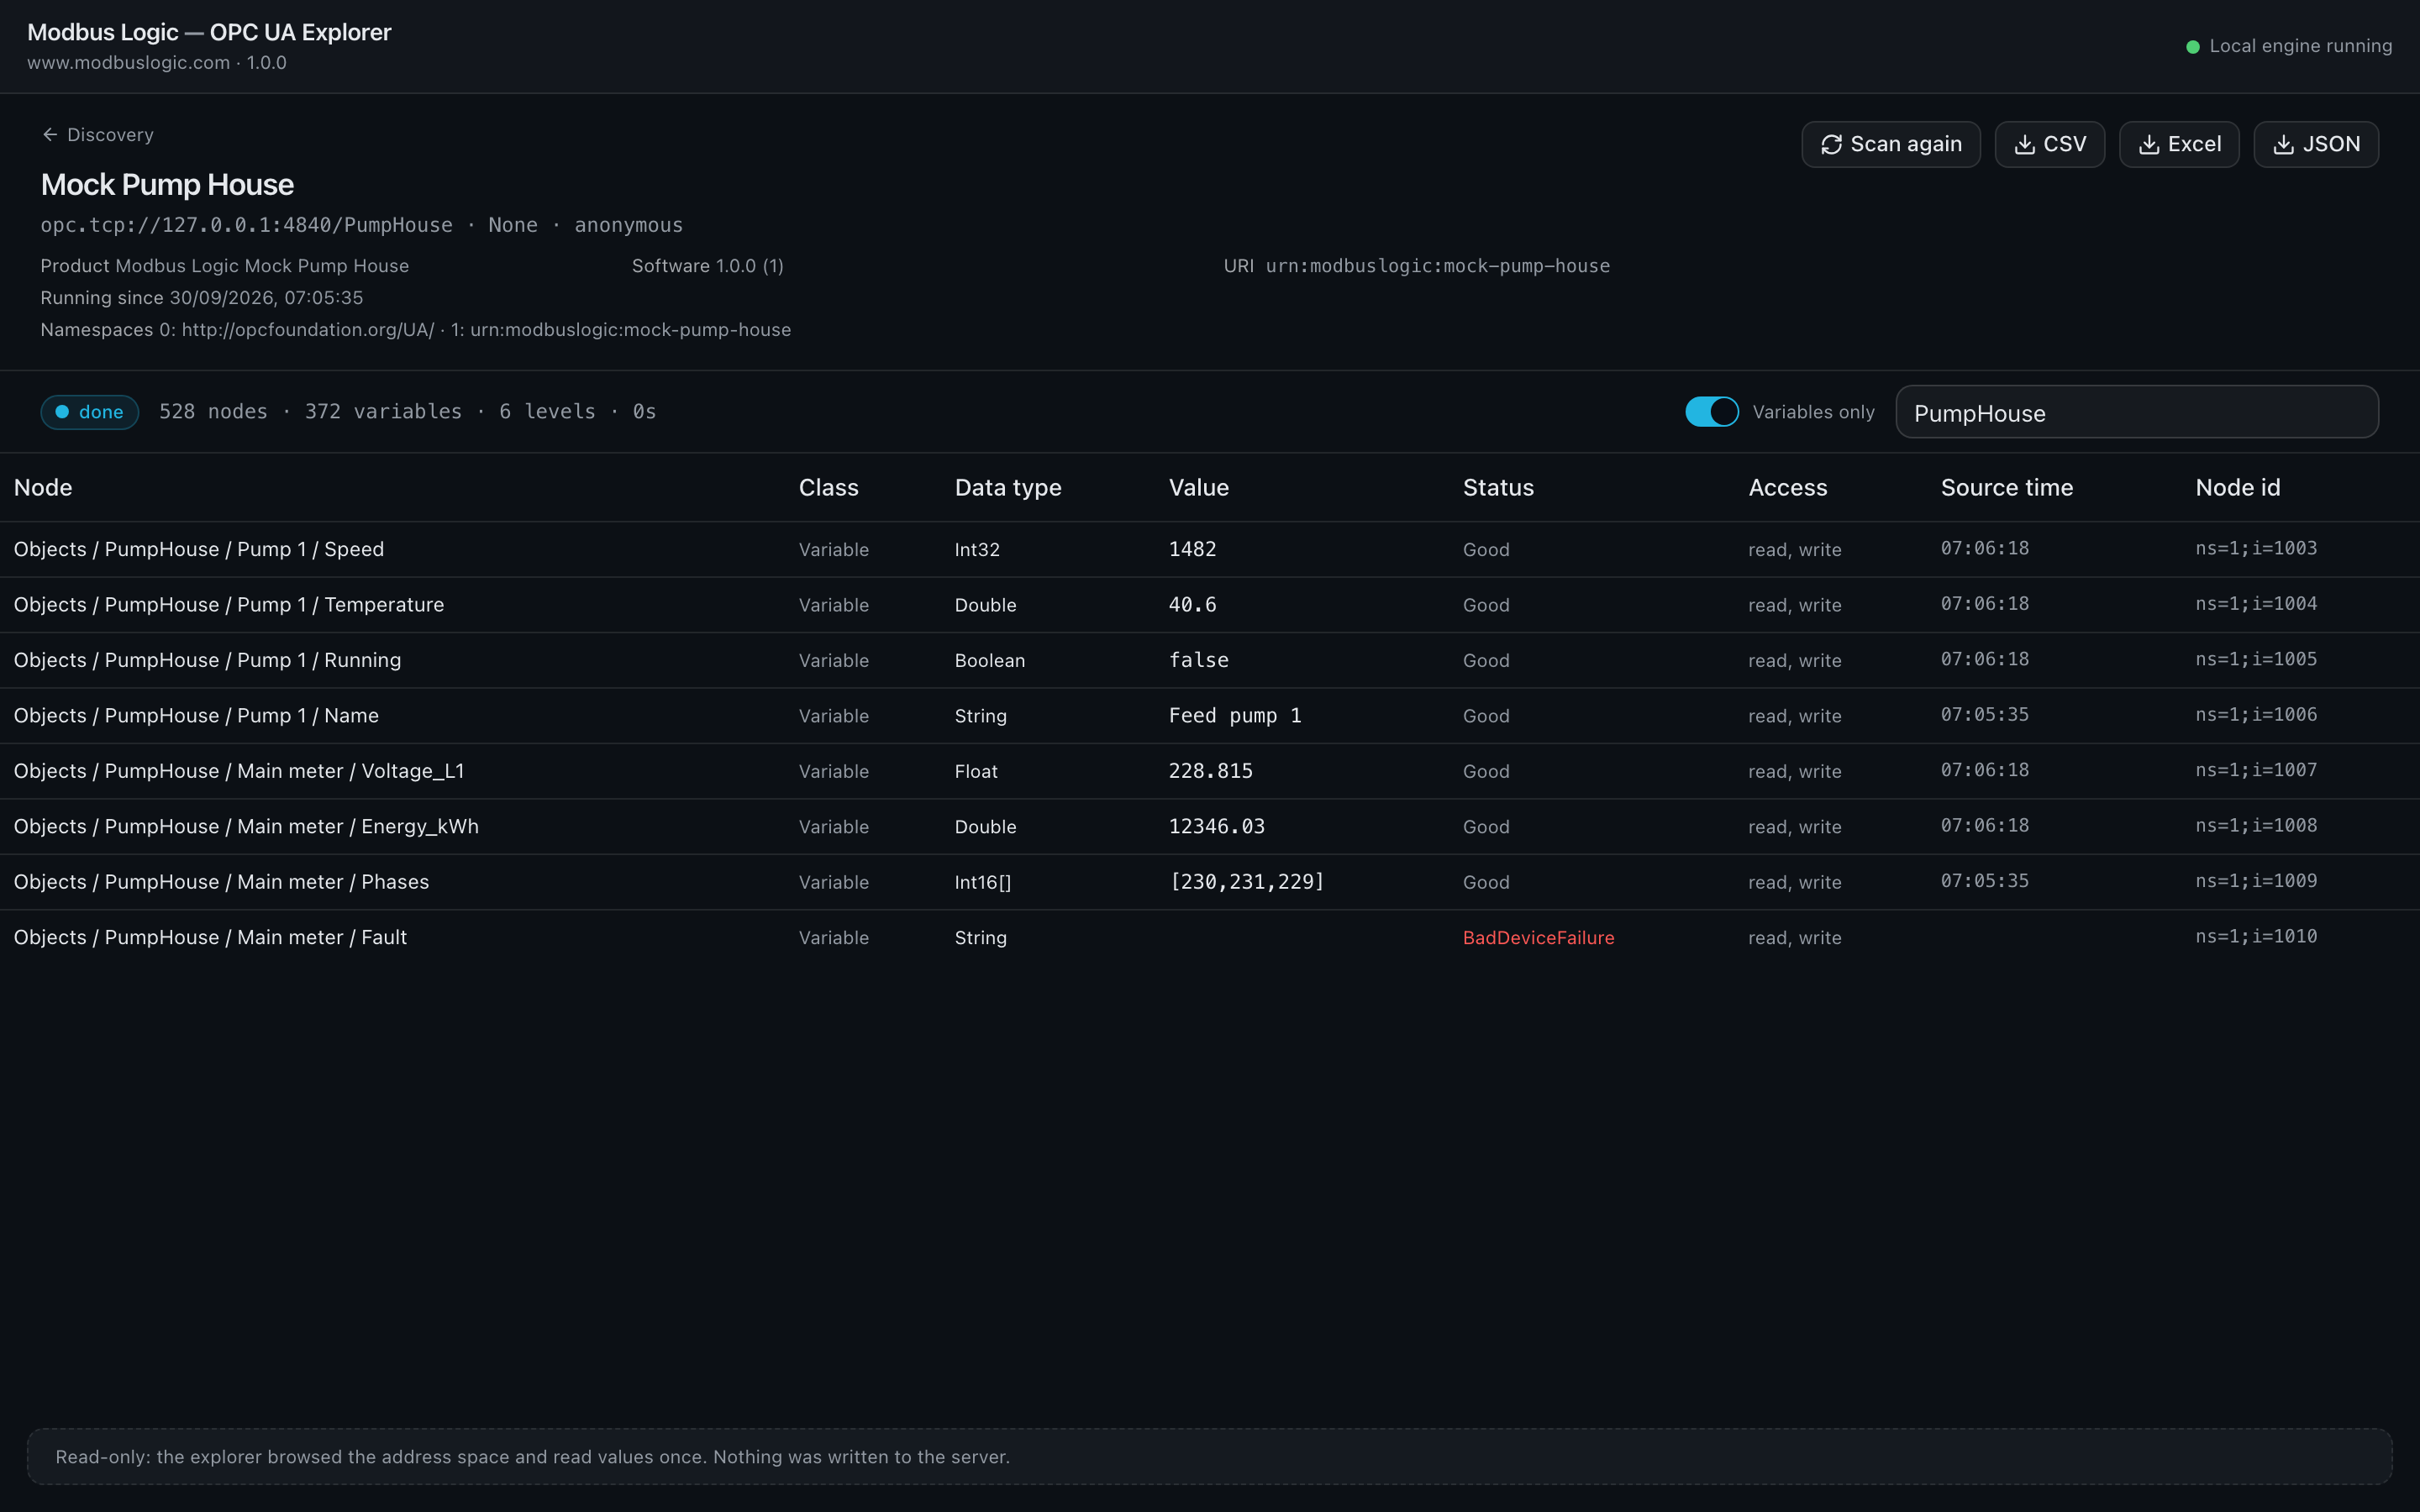
- Turn Variables only on and type
PumpHousein the filter. Eight rows remain, each with its whole path: the pump's *Speed* as an Int32, *Temperature* as a Double, *Running* as a Boolean and *Name* as a String; the meter's *Voltage_L1*, *Energy_kWh* and the *Phases* array of Int16. - The last row is the point of the exercise: the meter's Fault variable has the status *BadDeviceFailure* and no value. The server answered the read with that status code, and the explorer shows it as it is, rather than an empty cell. In a real plant this is the row to ask the vendor about.
- CSV, Excel or JSON exports the eight rows as filtered, or the whole scan with the switch off. The scan also stays in the history on the discovery page.
npm run mock-server starts it on port 4840, so the walk-through above can be repeated on any PC.Discovering servers
- Network ranges start as this PC's own /24 networks. Add or replace them: CIDR (
192.168.1.0/24), a range (192.168.1.10-50) or one address. The limit is in Settings. - Ports: 4840 is the OPC UA default and the Local Discovery Server; 4841, 48010, 53530 and 62541 are common vendor ports. Add the port your servers use.
- mDNS: servers that announce themselves (
_opcua-tcp._tcp, the Local Discovery Server with multicast extension, many embedded servers) are heard for a few seconds. - Press Discover. Every open port is asked, as an OPC UA client would, to name its servers and endpoints. A port that is open but does not answer OPC UA is listed apart.
A row shows the server's application name and URI, the address it was found at, and its endpoints in one line (security modes and user token types). A discovery server (LDS) that lists several servers says so.
Scanning a server
Scan on a row opens the choices: the endpoint (security mode and policy exactly as the server offers them, least demanding first), anonymous or user name sign-in (the password is sent once and not kept), the node and depth limits, and whether to read values or browse only.
- A server that advertises a host name your PC cannot resolve is connected to at the address it was found on; the switch in the dialog says so and can be turned off.
- Sign and SignAndEncrypt need the server to trust the explorer's certificate, made on first use under the data folder in
pki/own/certs. Until it does, the server refuses the connection and the scan says so.
The result page fills as the scan goes: the server's product, software version, start time and namespaces at the top, then the tree from the Objects folder down, one row per node with its class, data type, value, status, access level, source timestamp and node id. Filter by name, node id, value or type; Variables only hides the folders. Scan again repeats it; Stop ends it early and keeps what was read.
| Column | Meaning |
|---|---|
| Node | The display name, indented by depth; with a filter, the whole path. |
| Class | Object, Variable, Method, View, or a type node. |
| Data type | The built-in type (Double, Int32, String, Boolean…) or the named type; [] marks an array. |
| Value | What the server answered, as text; long values are cut and shown whole on hover. |
| Status | Good, or the status code the server gave for that read (BadNotReadable, BadDeviceFailure…). |
| Access | read, write, history read, history write: what the server says a client may do. The explorer only reads. |
Exports and history
CSV, Excel and JSON export the table, or only the variables when that switch is on. The Excel file has a Server sheet with the description and namespaces and a Nodes sheet. The newest fifty scans stay in the local history on the discovery page and can be opened again.
Settings, the history and the certificate store live in %LOCALAPPDATA%\ModbusLogic\OpcUaExplorer on Windows and ~/.local/share/modbuslogic/opcua-explorer on Linux, or in a data folder beside the executable (portable mode). --data-dir, --port and --no-open are the command line options.
node-opcua (the OPC UA client) and bonjour-service (mDNS).