Modbus Client
Poll Modbus devices, watch decoded values as they change, write a register when you mean to, chart trends and log to a file. A tab per server; several servers at once.
What it is
The Modbus Client is a standalone Windows program that opens in your browser. Everything runs on your PC: the Modbus engine, the data logger and the project store. Nothing leaves the machine beyond the Modbus connections you configure.
- Run
ModbusClient.exe. It picks a free port, starts the local engine and opens the UI. Keep the console window open while you work; closing it stops the tool. - The header shows the engine state: green and Local engine running while the UI can reach it.
A worked example: polling a simulated energy meter
The screens below come from the Modbus Simulator serving an energy meter on this PC, port 5020, unit ID 1: float32 holding registers from address 100 for three voltages, three currents, frequency and active power, and a uint32 energy counter at 116. A physical meter on the network works the same way; only the host changes.
- Press Edit connection on the tab. Enter the host
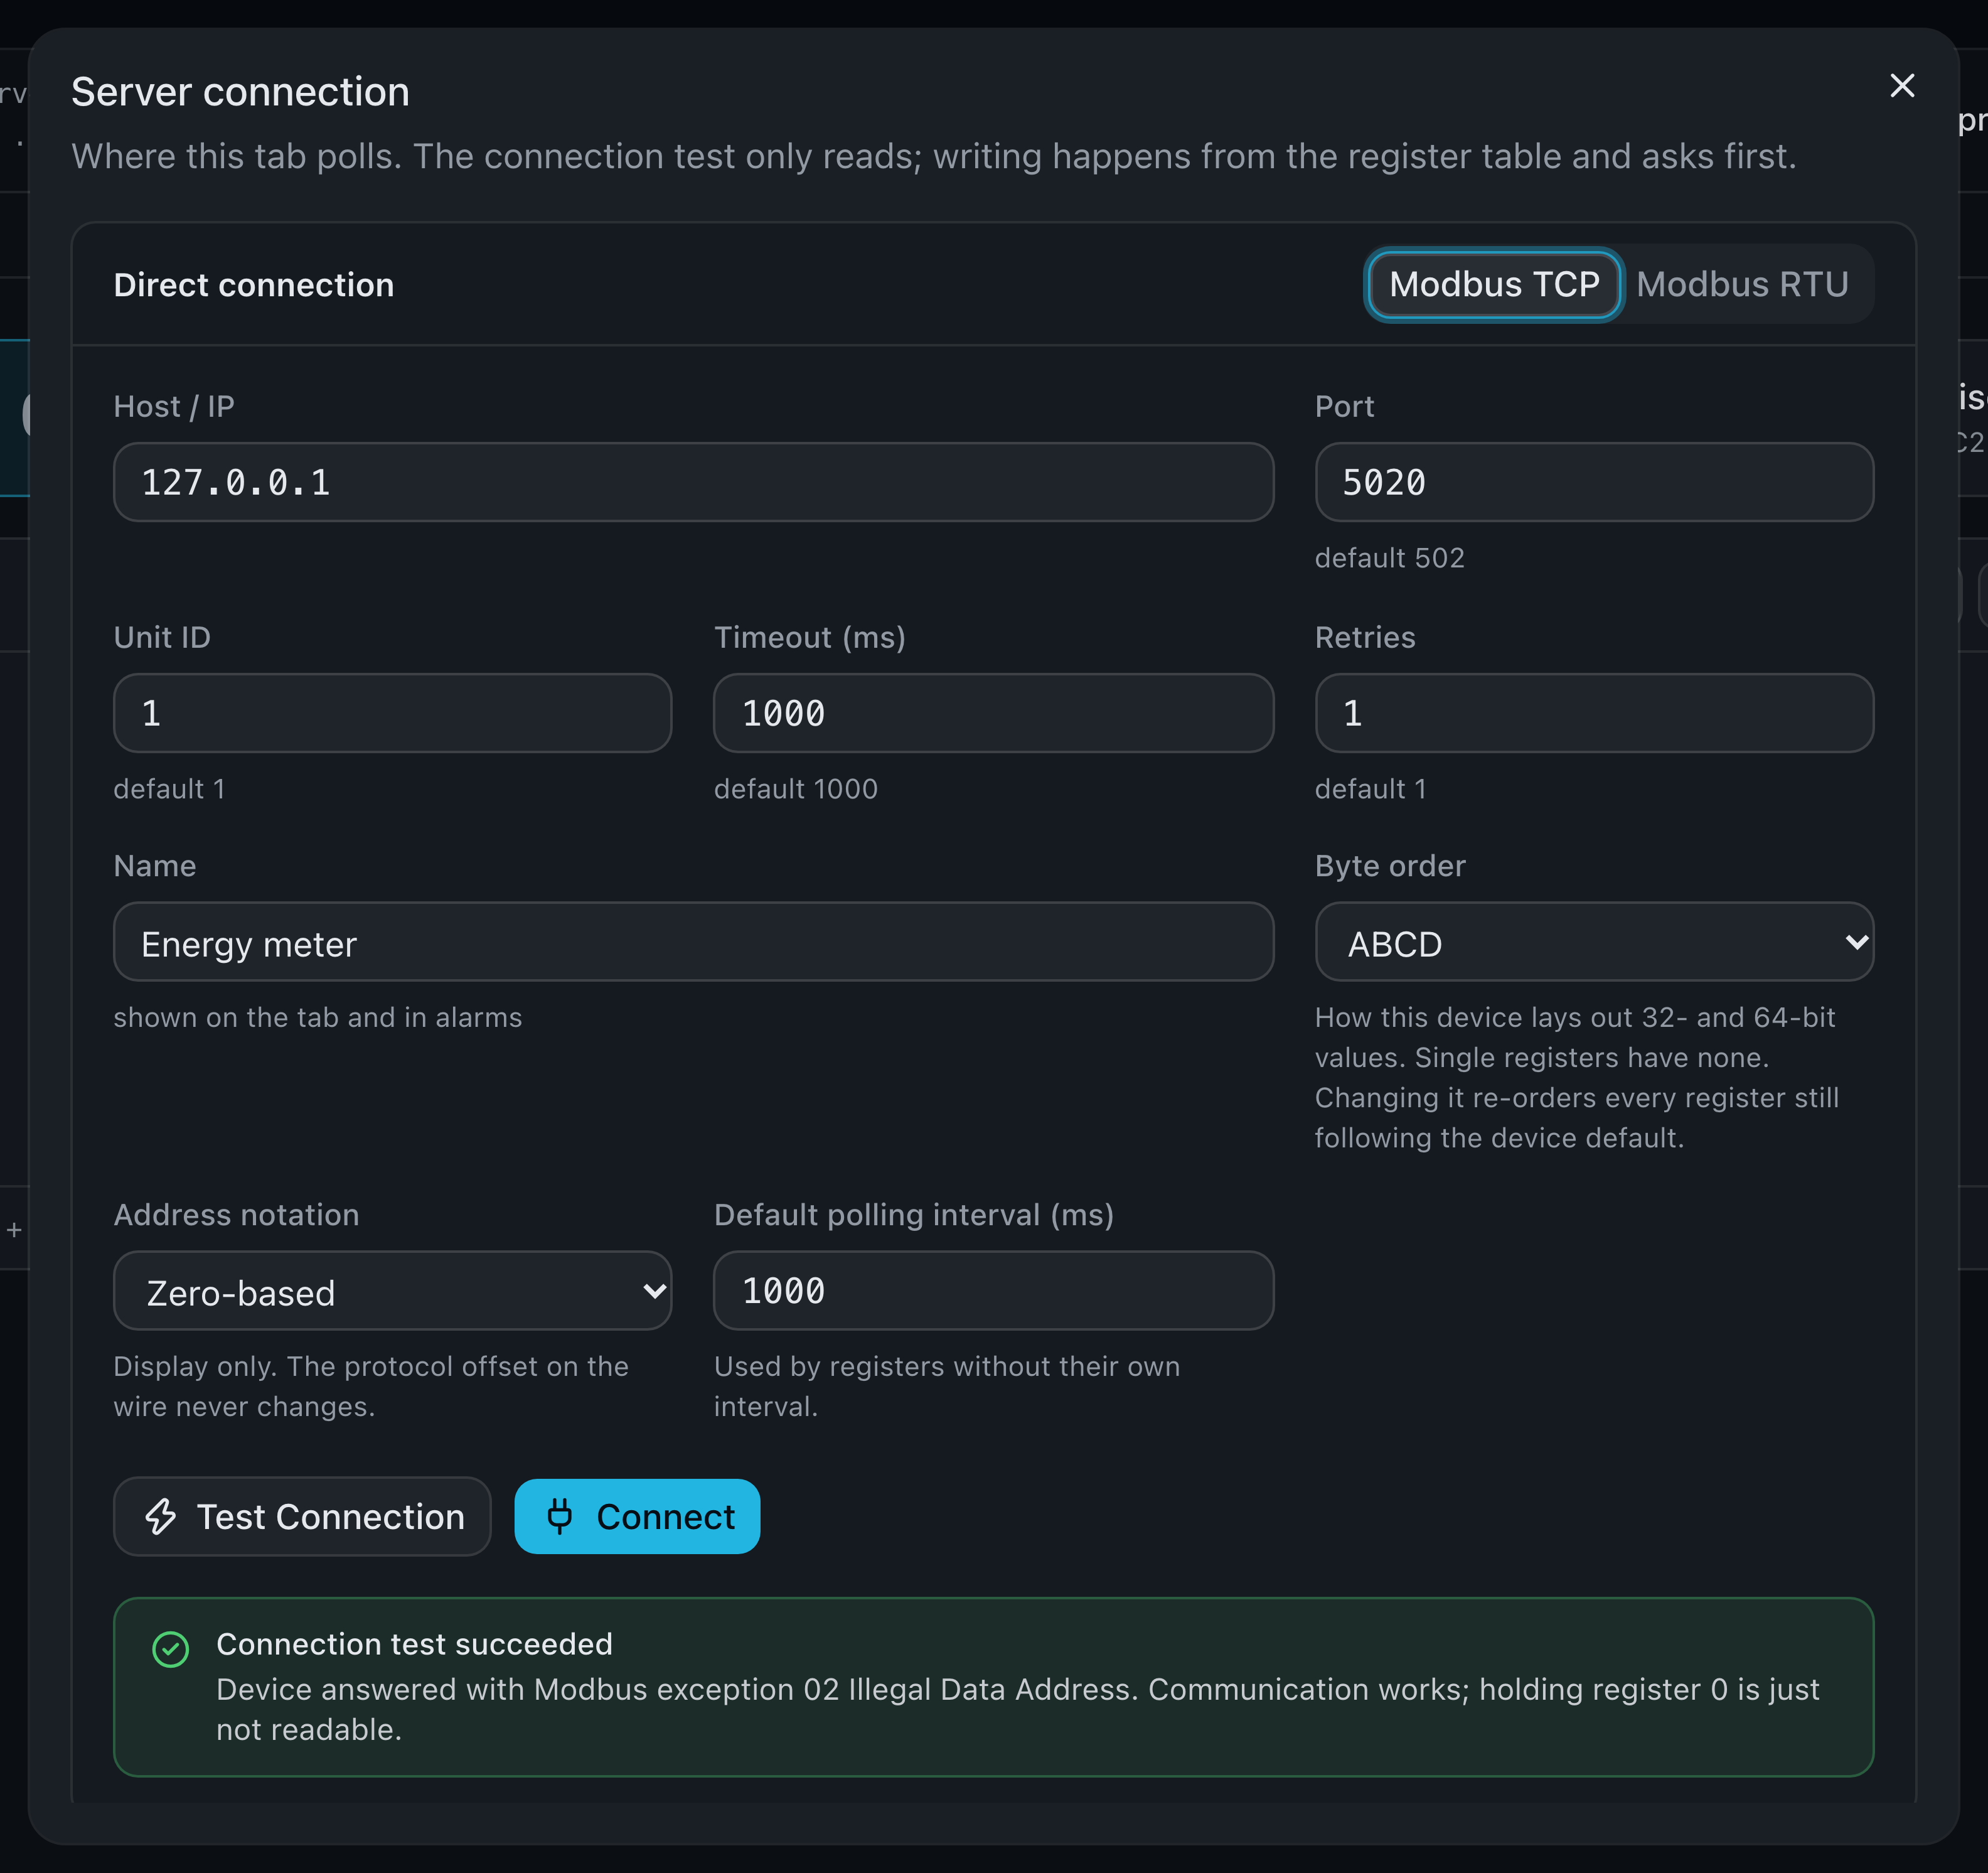
127.0.0.1, port5020, unit ID1and the name *Energy meter*; leave the byte order at ABCD and the polling interval at 1000 ms. Test Connection answers in a few milliseconds. Then Connect. - Add range: FLOAT32, start address
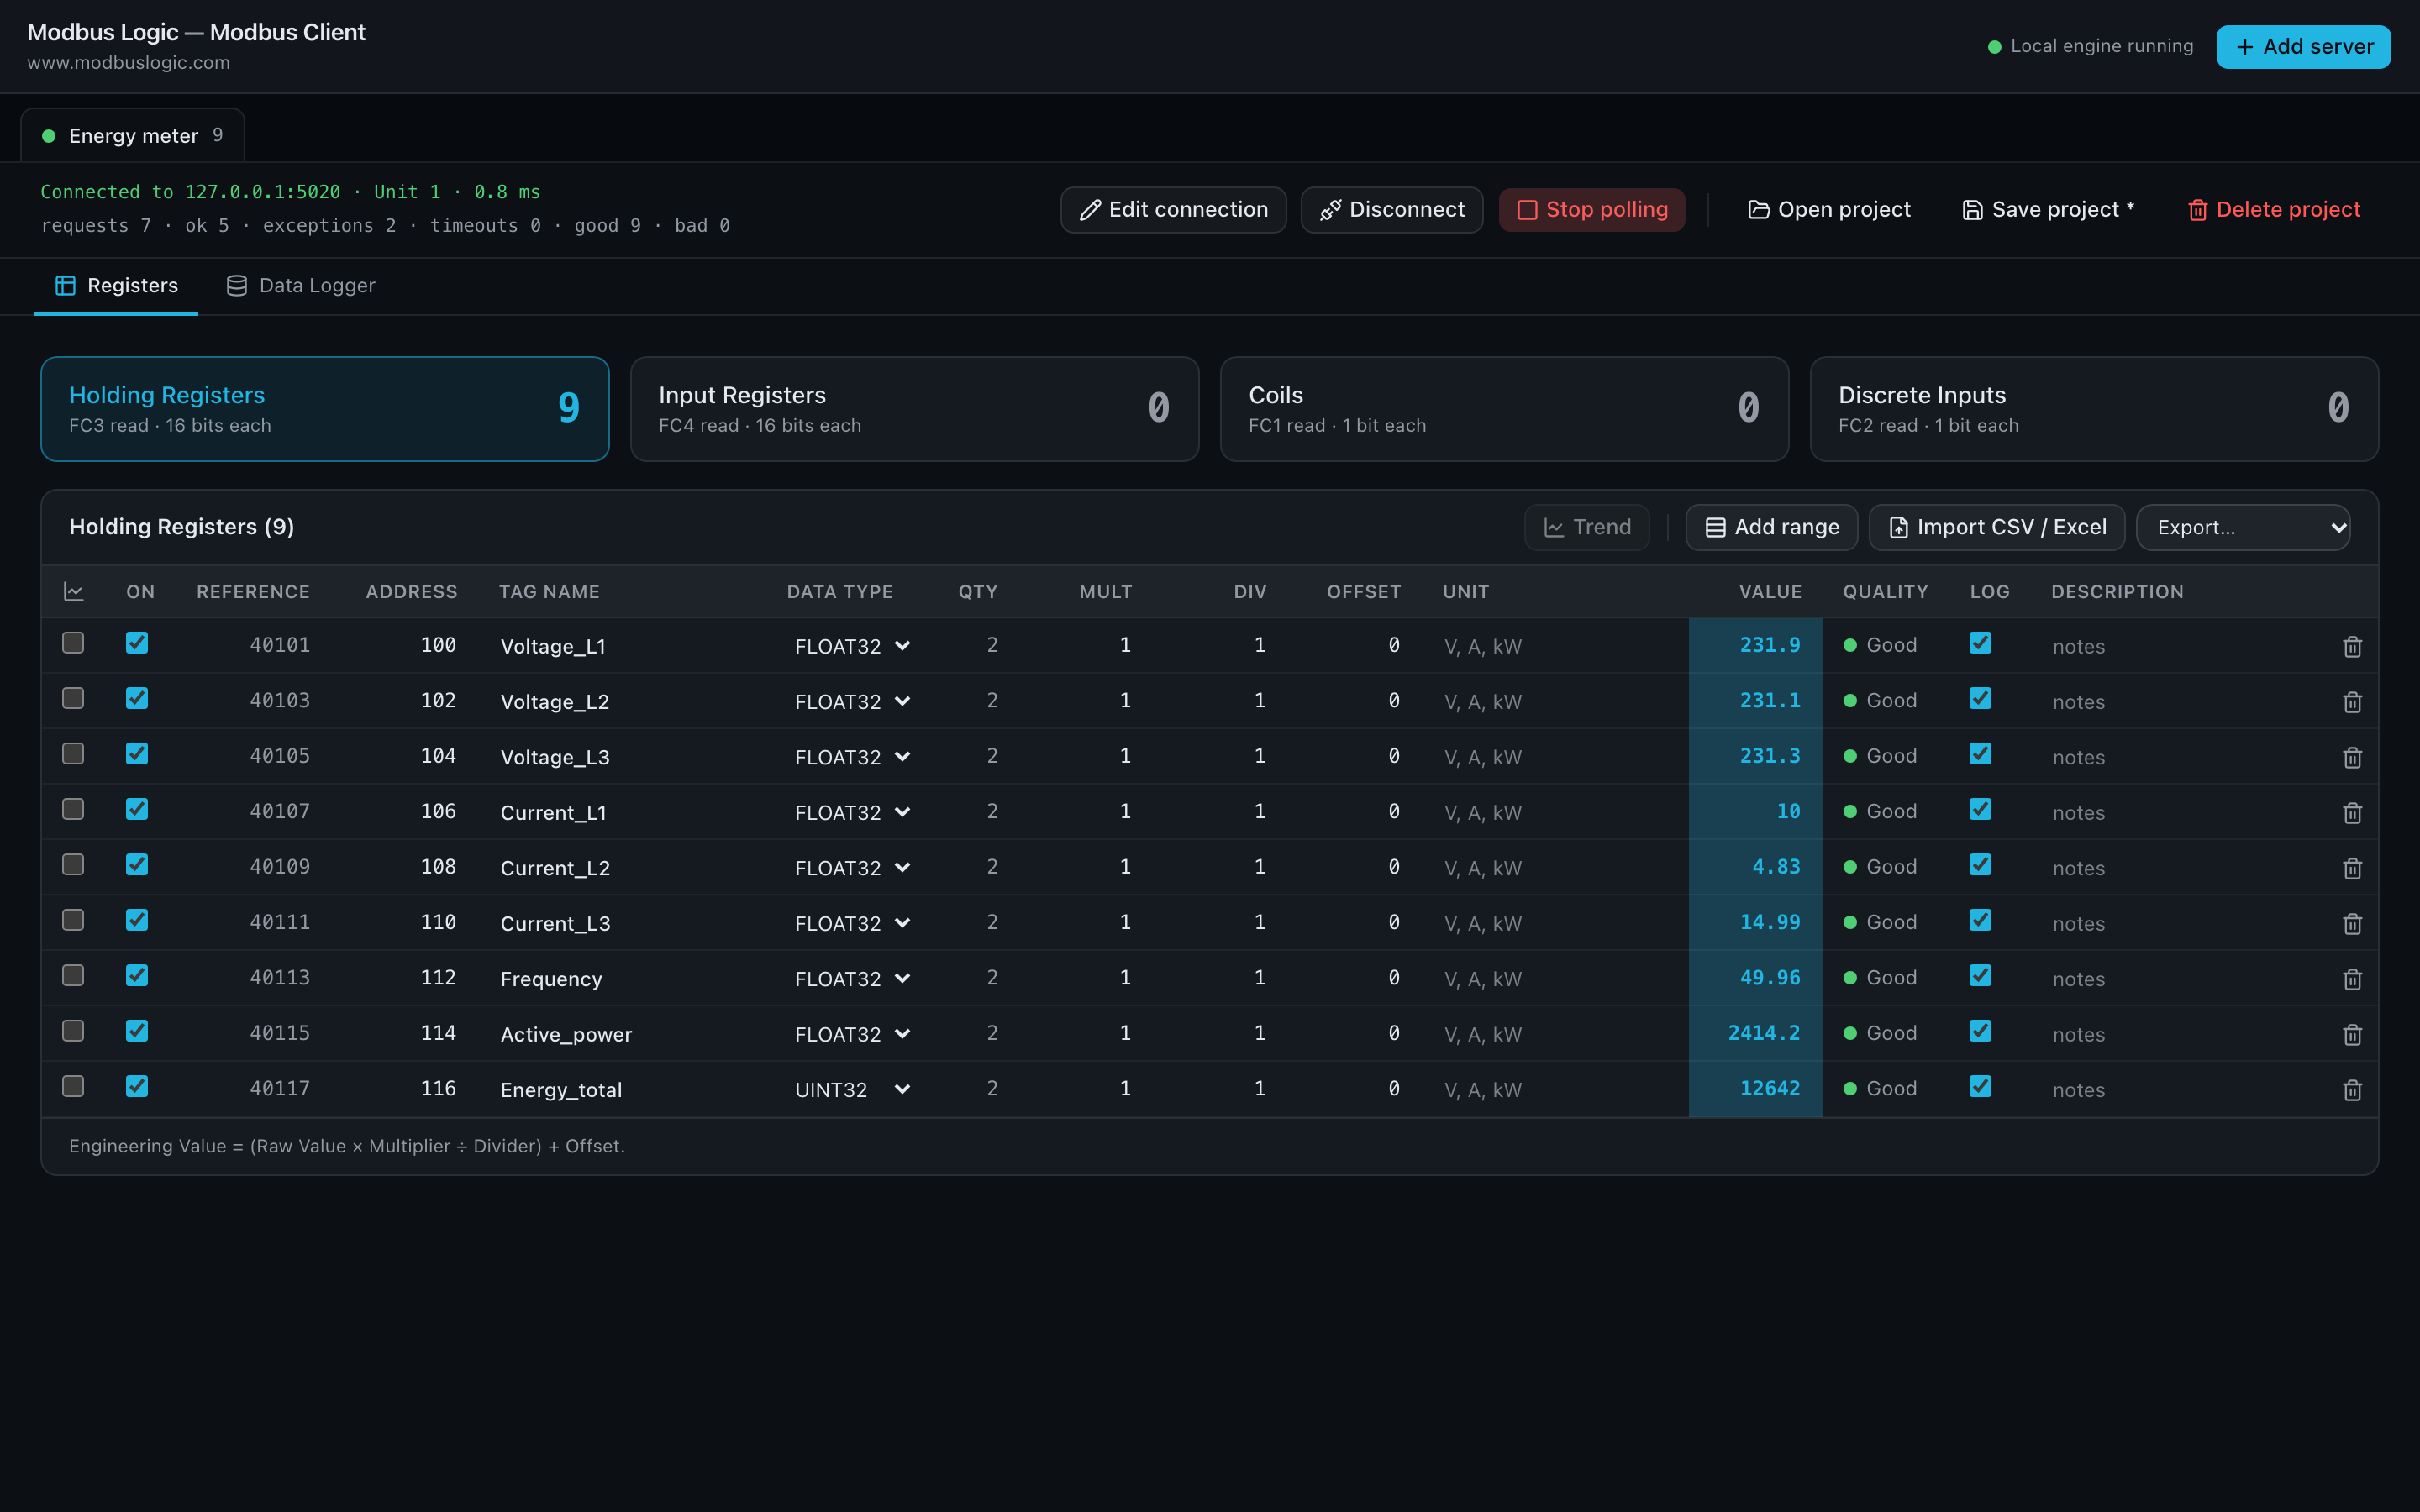
100, 3 registers, prefixVoltage_L. That creates *Voltage_L1*, *Voltage_L2* and *Voltage_L3* at 100, 102 and 104, because a float32 occupies two registers. Repeat withCurrent_Lfrom 106, then single registers *Frequency* at 112, *Active_power* at 114 and, as UINT32, *Energy_total* at 116, typing the plain name into the Tag name cell. - Press Start polling.
The table now updates once a second: nine holding registers, all *Good*, with the voltages near 231 V, the currents between 4 and 16 A, the frequency at 50 Hz and the energy counter climbing. The header counts requests, ok answers and exceptions, and shows the response time. Neighbouring registers are read in one block request, which is why nine registers cost far fewer requests than nine.
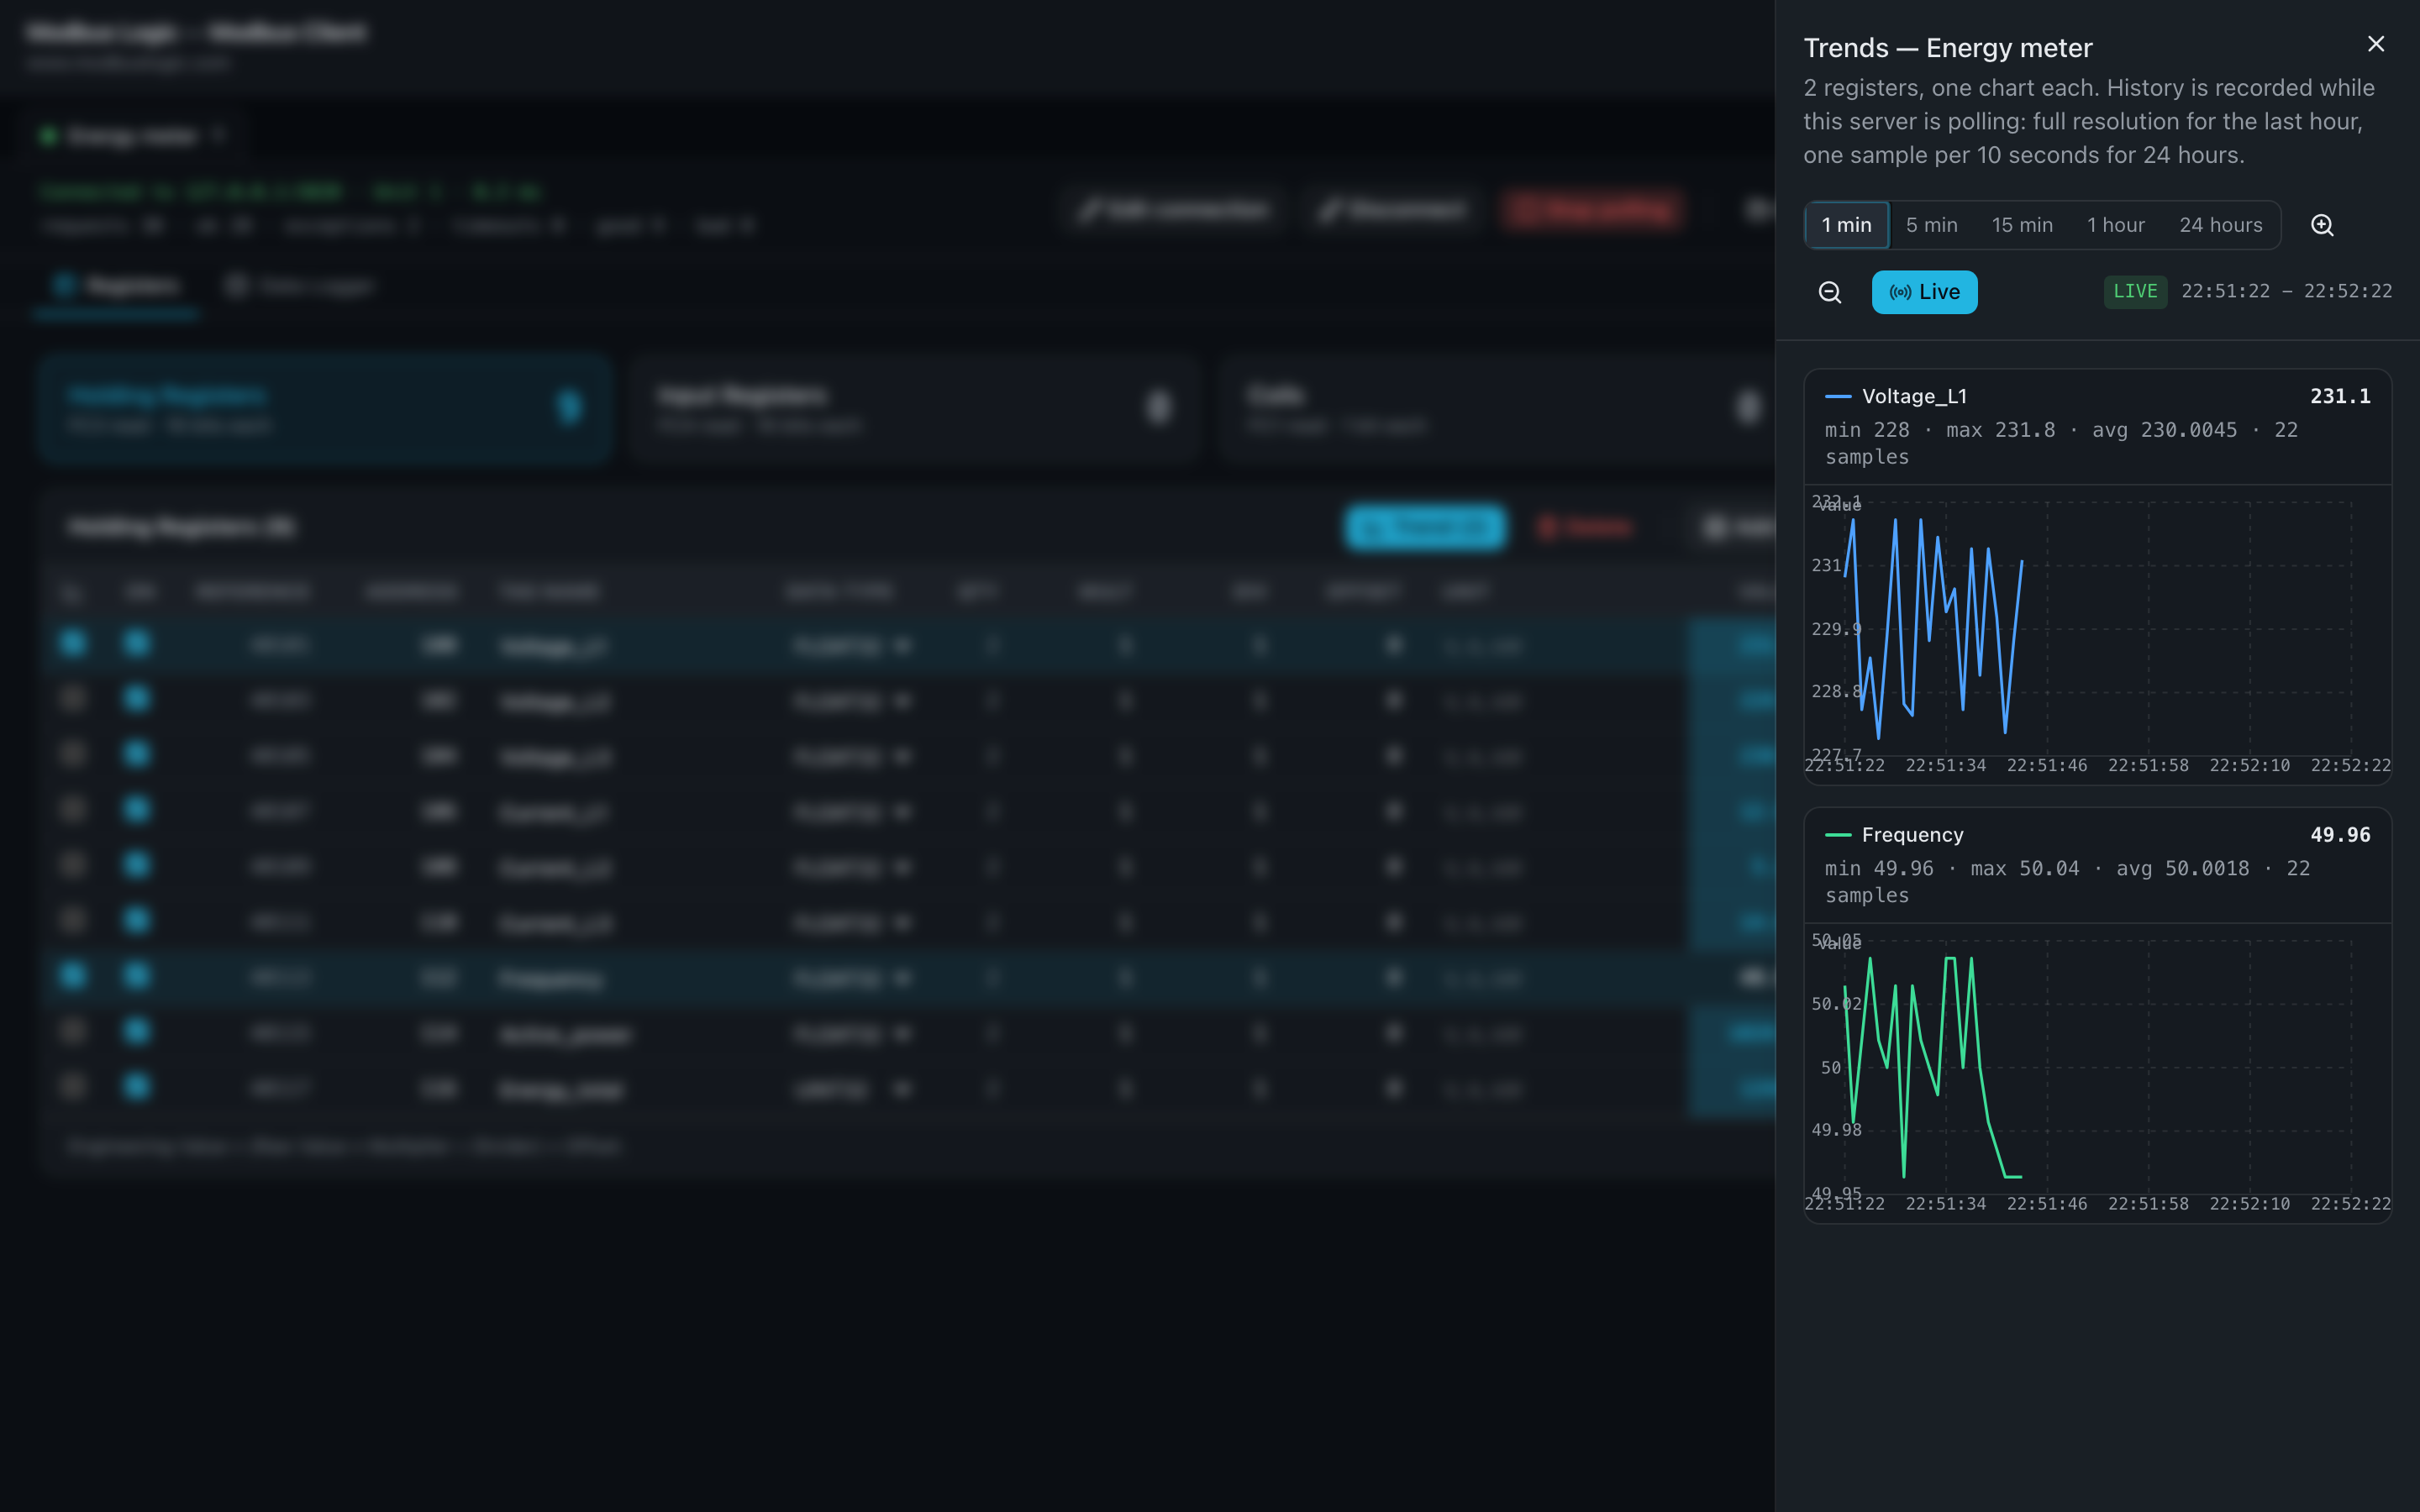
Tick *Voltage_L1* and *Frequency* in the first column, wait a minute while the history builds, and press Trend (2). The panel draws one chart per register on its own scale, with the current value and the minimum, maximum and average of the visible span, live until you pan away.
From here, tick Log on the registers you want in a file and start the Data Logger, or Save project so the meter, its registers and the logger settings reopen next time.
Servers and tabs
A tab is a server: one Modbus TCP target (host, port, unit ID) or one serial slave. Everything inside the tab, from registers to trend selection, belongs to that server, so address 100 on two servers is two different registers.
- + Add server opens a new tab and its connection dialog straight away. A tab's ✕ removes it, after confirming how many registers go with it.
- The tab shows a status dot and the register count; the panel head shows the target, unit, response time and the device identity if it reports one, then
requests · ok · exceptions · timeouts · good · bad. - Two servers poll at once, each at its own rate; one failing does not slow the other. Two unit IDs on the same host and port share one socket.
Connecting
Edit connection opens the dialog. Modbus TCP takes host, port (502), unit ID, timeout and retries. Modbus RTU lists the COM ports with a Refresh Ports button, then baud rate, data bits, stop bits, parity and slave ID. A Name labels the tab; empty, it defaults to host:port.
- Test Connection answers with the round-trip time and the device identity when the device reports one, or a red panel naming the failure with a troubleshooting card beneath it.
- Connect opens the link, the status strip turns green and polling can start. Disconnect closes it; polling stops. Reconnect from the dialog re-opens it in place and polling continues.
- A missing host or port is refused with a message, not a greyed button.
The register map
Four cards select a register space: Holding Registers (FC3), Input Registers (FC4), Coils (FC1) and Discrete Inputs (FC2). The table beneath shows that space's registers for this server.
| Column | Meaning |
|---|---|
| Reference · Address | The reference form (40001, 30001, 00001, 10001) and the protocol offset. The address notation, zero-based, one-based or reference, is a display choice; the wire address never changes. |
| Tag name · Data type · Qty | The name as it appears in logs and trends; BOOL, BIT, INT16, UINT16, INT32, UINT32, INT64, UINT64, FLOAT32, FLOAT64, ASCII, HEX, BINARY; how many registers it occupies. |
| Mult · Div · Offset · Unit | Engineering value = (raw × multiplier ÷ divider) + offset. |
| Value · Quality | The live reading, highlighted when it changes; Good, Bad (with the exception on hover), Waiting or Off. |
| Log | Whether the data logger records it. |
- Add range creates consecutive registers of one data type, a name prefix numbering them; a count of 1 adds a single register. Multi-register types advance by their size.
- Import CSV / Excel reads a register map, or an
io-tags.jsonfrom the Modbus Scanner with names, types, byte order and scaling. Registers that already exist are skipped and the count reported; invalid rows are named. - Export… writes io-tags.json, CSV, Excel or JSON of the space.
- Changing a register's data type or quantity moves the registers after it so no two cover the same address, keeping gaps; typing an address already in use re-separates the map and says how many moved. Nothing can be pushed past 65535.
Polling and live values
Start polling needs a connected server and at least one register; the reason it is disabled is written beside it. While polling, the value column updates at the polling interval, changes flash, and the counters move.
- Neighbouring registers are read in one block request; a register added later joins the block on the next cycle.
- A refused address is read on its own from then on, so one bad register cannot take its neighbours down: they return to Good, it stays Bad with the exception.
- A device that stops answering marks its registers Bad and keeps the last value; polling resumes on its own when it returns.
- No register is polled faster than the configured minimum interval, and starting faster than the warning threshold asks first.
Writing a register
Holding registers and coils can be written; input registers and discrete inputs cannot, because Modbus has no write for them, and their value cells are plain text. Type a value into a writable register's Value cell: it is staged, not sent, and incoming readings do not overwrite what you typed. A red Write button appears.
- Press Write. A dialog names the server and lists each staged register with its address, the value now and the new value.
- Cancel sends nothing; the staged value stays. Write sends FC6 or FC16 for registers, FC5 or FC15 for coils.
- The register is read back straight away, so the table shows what the device kept, not what was sent.
Trends
Tick up to five registers and press Trend (n). A panel opens from the right, titled with the server, with one chart per register on its own scale, its current value and the min, max, average and sample count of the visible span. History is recorded while the server is polling: full resolution for the last hour, one sample per ten seconds for 24 hours, and it survives closing the panel.
- Ranges of 1 min to 24 hours; wheel to zoom, drag to pan. Live follows the clock; panning away pauses, and the badge says which.
- While the history is shorter than the span the line fills left to right; once longer, the window scrolls.
- Each tab keeps its own ticks.
Data logger
The Data Logger section writes ticked registers to a file at its own interval: CSV, Excel or SQLite, with optional timestamp and quality columns, rotated by size or time. It shows the file it is writing, its size and the files written, and Open log folder opens them.
- Registers from two servers log with
Server / Tagheaders, so identical names stay distinct. - Adding or removing a logged register starts a new file rather than shifting columns mid-file.
- Closing the tool while logging finalises the open file; an Excel file becomes readable once closed or rotated.
Projects
A project is every server with its registers, scaling and logger settings. Work is autosaved to the local database; Save project records it under its name and clears the * marker, Open project lists saved ones, New project starts empty and disconnects the previous servers, Delete project asks first.
- Save as .modbuslogic file and Open .modbuslogic file move a project between PCs. The file format is shared with the Modbus Scanner: a Scanner project opens here with its tags, and a two-server project opens there showing the first server.
- The last project reopens when the tool starts.
Safety and privacy
- Polling only reads: FC01–FC04 and the read-only device identification. The only write path is the Write button, which states what it will change and asks first.
- The local server listens on 127.0.0.1 only; requests from other machines and cross-origin requests are refused.
- Fully offline, no telemetry. Settings, projects and history live in a local SQLite database; log files go only to the folder you choose.